Data Diffing
Data diffing validates that your model changes produce the expected results. Each diff type serves a different validation purpose, from quick row counts to detailed value comparisons.
Overview
| Diff Type | Purpose | Query Cost | Best For |
|---|---|---|---|
| Row Count | Compare record counts | Low | Quick sanity check |
| Profile | Column-level statistics | Medium | Distribution analysis |
| Value | Row-by-row comparison | High | Exact match verification |
| Top-K | Categorical distribution | Medium | Categorical columns |
| Histogram | Numeric distribution | Medium | Numeric columns |
| Query | Custom SQL comparison | Varies | Flexible validation |
Choosing the Right Diff
A common approach is to start with lightweight checks and progressively drill down as needed. This decision tree provides a suggested workflow:
Start with Row Count
    │
    ├─ Counts match? → Profile Diff for deeper stats
    │
    └─ Counts differ?
           │
           ├─ Expected? → Document in checklist
           │
           └─ Unexpected? → Value Diff to find specific changes
                              │
                              └─ For specific columns:
                                    • Categorical → Top-K Diff
                                    • Numeric → Histogram Diff
                                    • Custom logic → Query Diff
Row Count Diff
Compare the number of rows between base and current environments.
When to use: Quick validation that filters or joins didn't unexpectedly add or remove records.
Running Row Count Diff
- Click a model in the Lineage DAG
- Click Explore Change > Row Count Diff
Interpreting Results
| Result | Meaning |
|---|---|
| Count unchanged | No records added or removed |
| Count increased | New records added (check if expected) |
| Count decreased | Records removed (verify filters/joins) |
Profile Diff
Compare column-level statistics between environments.
When to use: Validate that transformations didn't unexpectedly change data distributions.
Statistics Compared
| Statistic | Description |
|---|---|
| Row count | Total records |
| Not null % | Proportion of non-null values |
| Distinct % | Proportion of unique values |
| Distinct count | Number of unique values |
| Is unique | Whether all values are unique |
| Min / Max | Range of values |
| Average / Median | Central tendency |
Running Profile Diff
- Select a model from the Lineage DAG
- Click Explore Change > Profile Diff
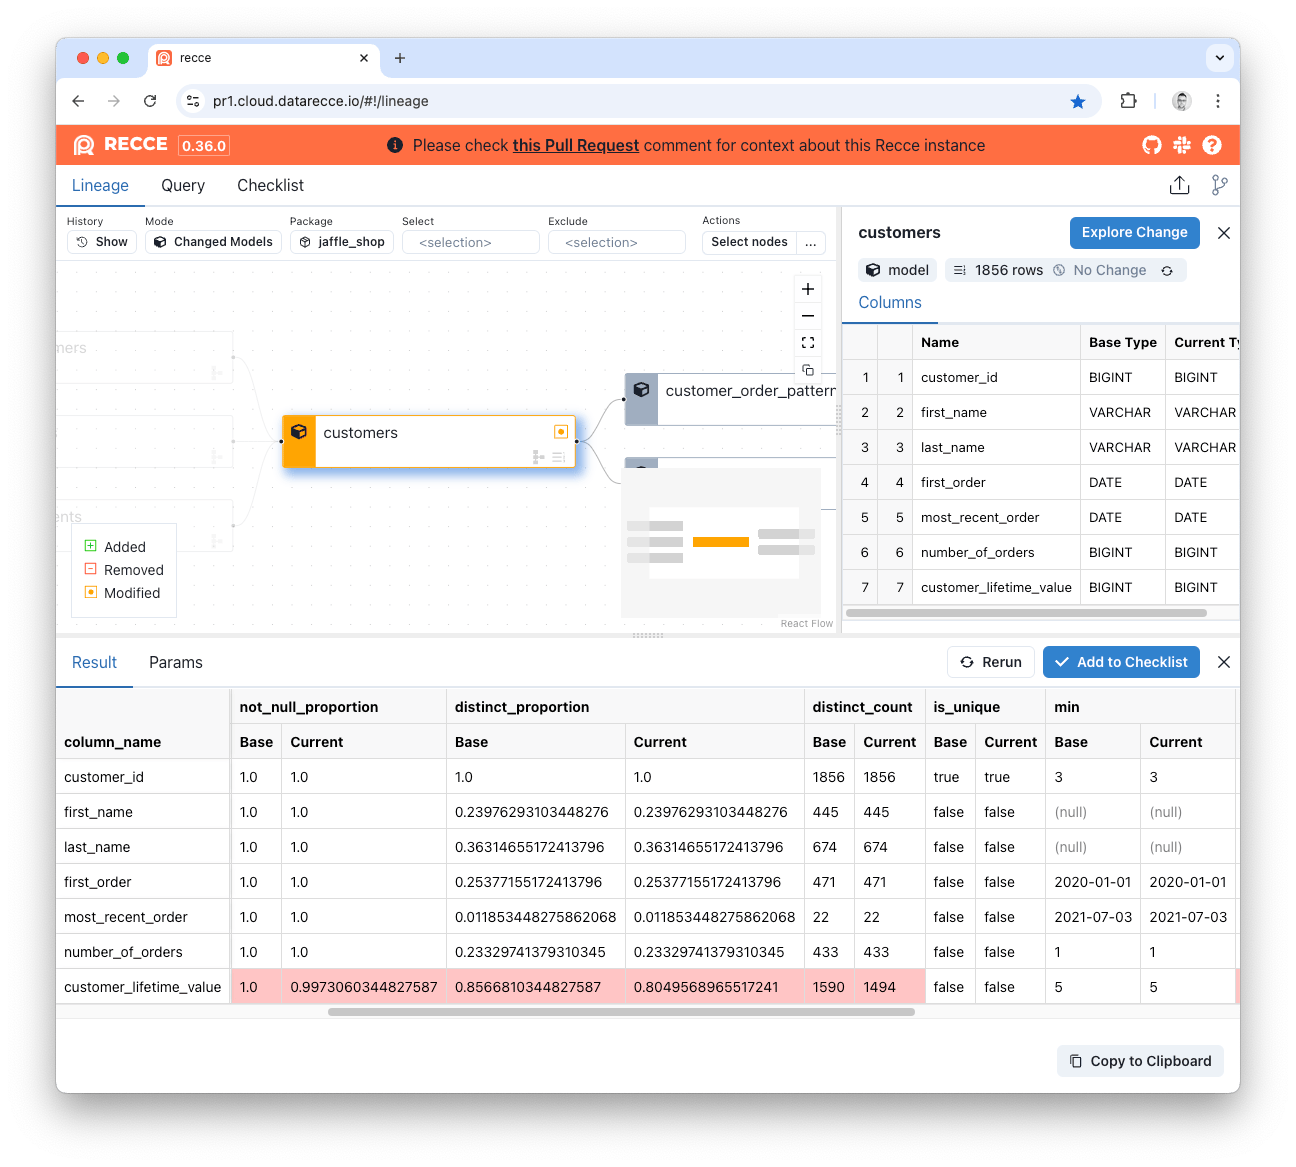
Interpreting Results
Look for unexpected changes in:
- Null rates - Did a column become more/less nullable?
- Distinct counts - Did cardinality change unexpectedly?
- Min/Max - Did value ranges shift?
Value Diff
Compare actual values row-by-row using primary keys.
When to use: Verify exact data matches when precision matters.
How It Works
Value Diff uses primary keys to match records between environments, then compares each column value. Primary keys are auto-detected from columns with the unique test.
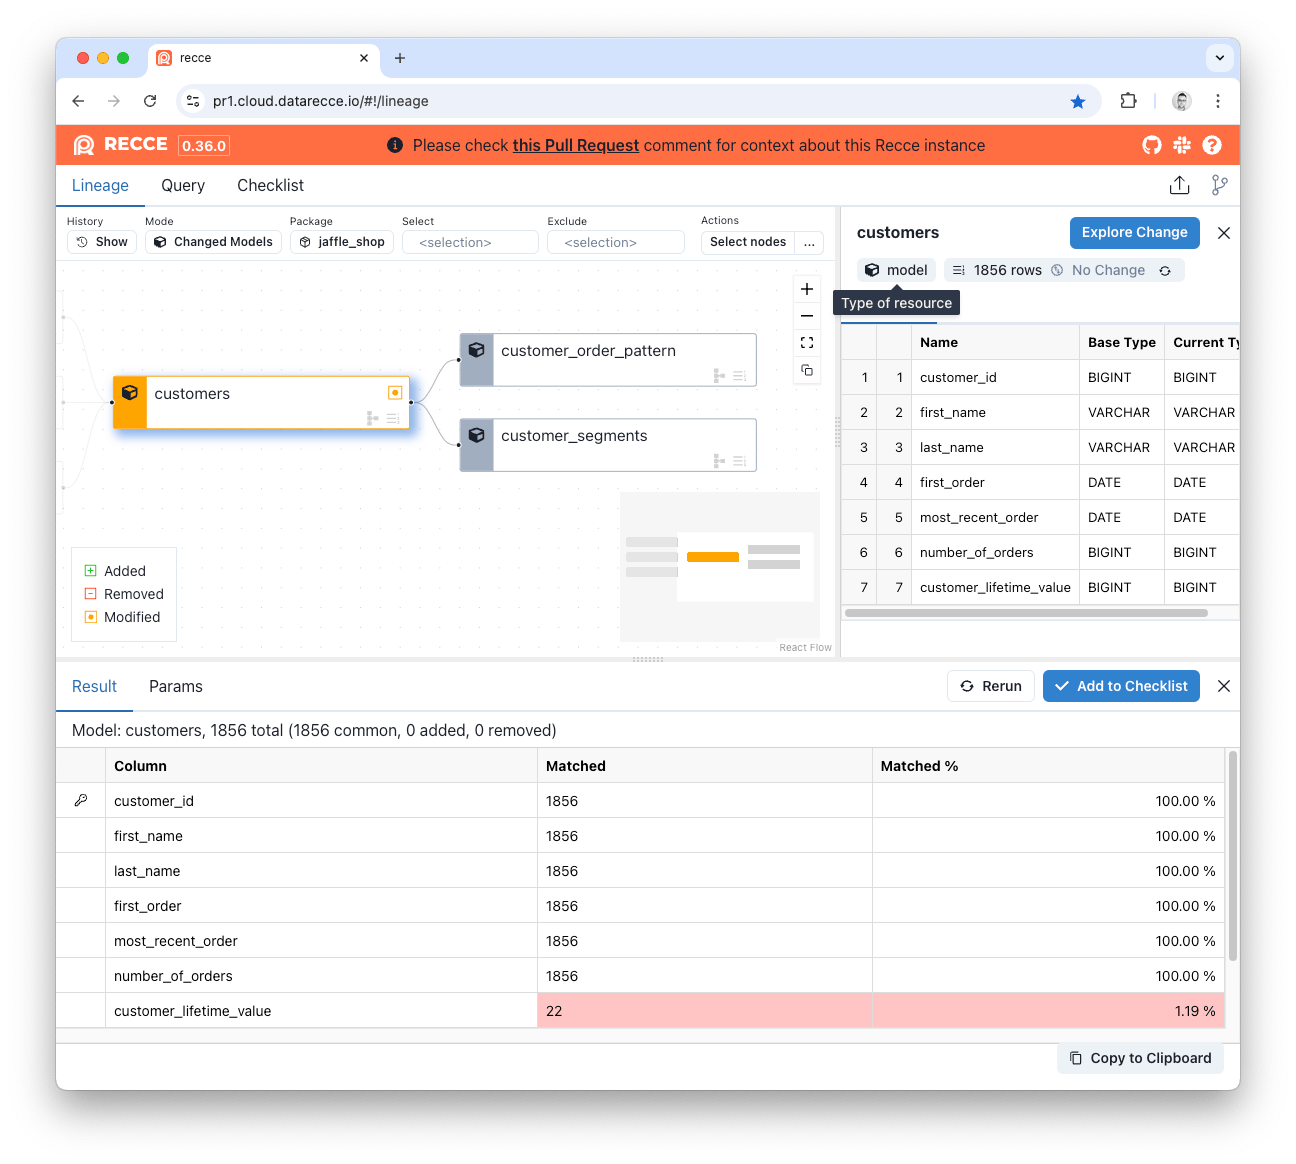
Result Columns
| Column | Meaning |
|---|---|
| Added | New PKs in current (not in base) |
| Removed | PKs in base (not in current) |
| Matched | Count of matching values for common PKs |
| Matched % | Percentage match for common PKs |
Viewing Mismatches
Click show mismatched values on a column to see row-level differences:
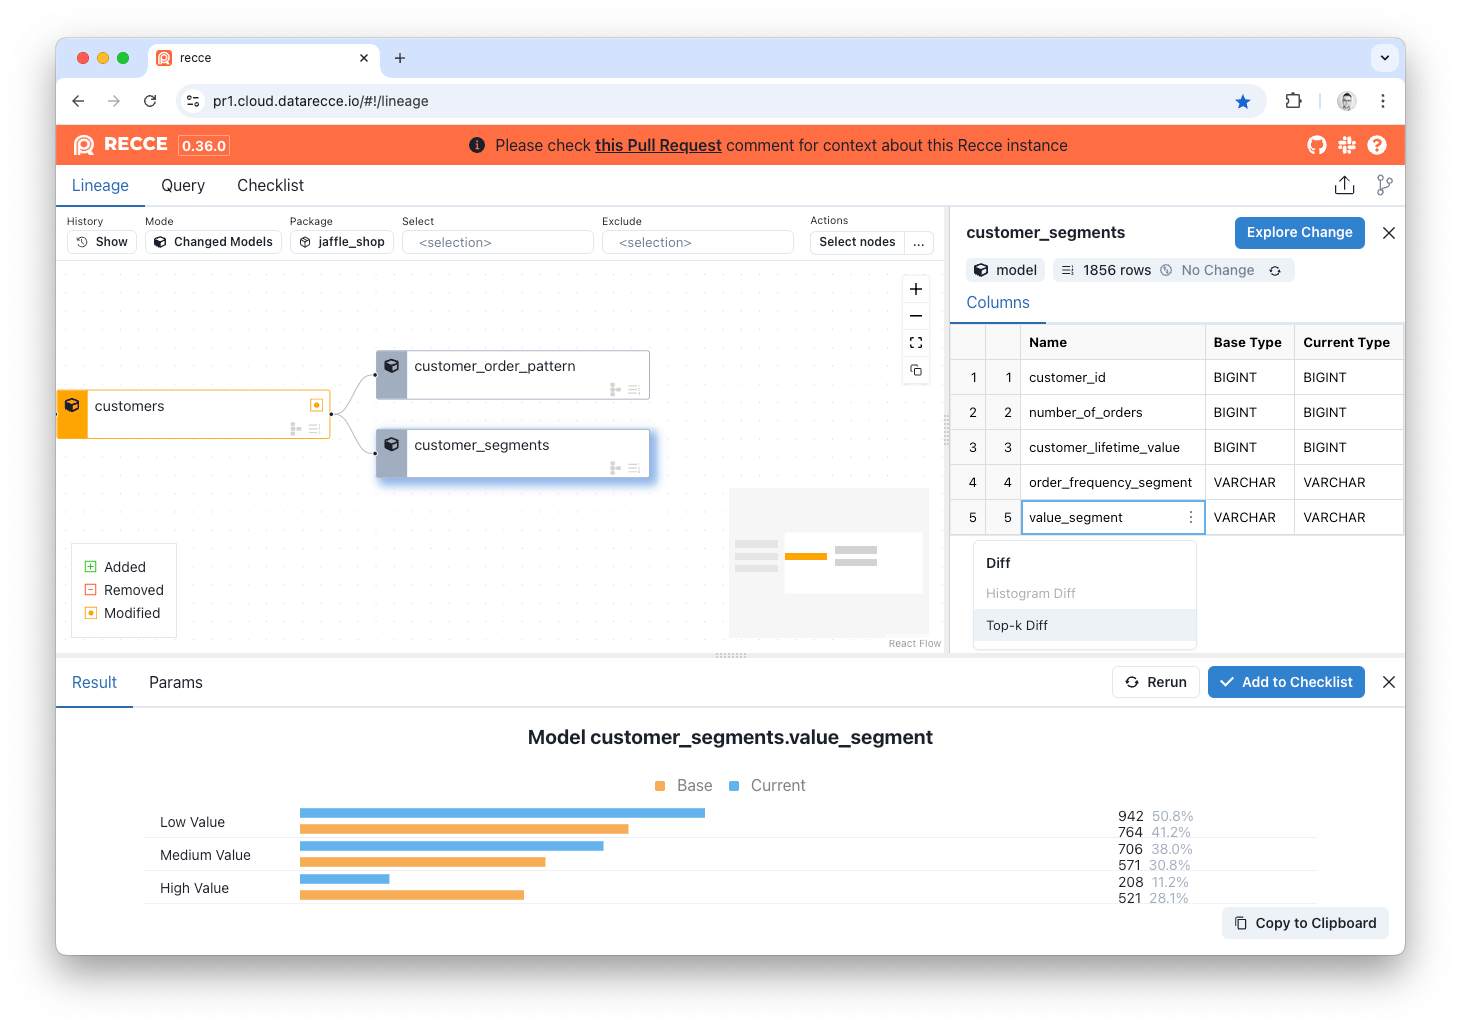
Top-K Diff
Compare the distribution of categorical columns by showing the most frequent values.
When to use: Validate categorical data hasn't shifted unexpectedly (status codes, categories, regions).
Running Top-K Diff
Via Explore Change:
- Select model > Explore Change > Top-K Diff
- Select a column
- Click Execute
Via Column Menu:
- Hover over a column in Node Details
- Click ... > Top-K Diff
Options
| Option | Description |
|---|---|
| Top 10 | Default view |
| Top 50 | Expanded view for more categories |
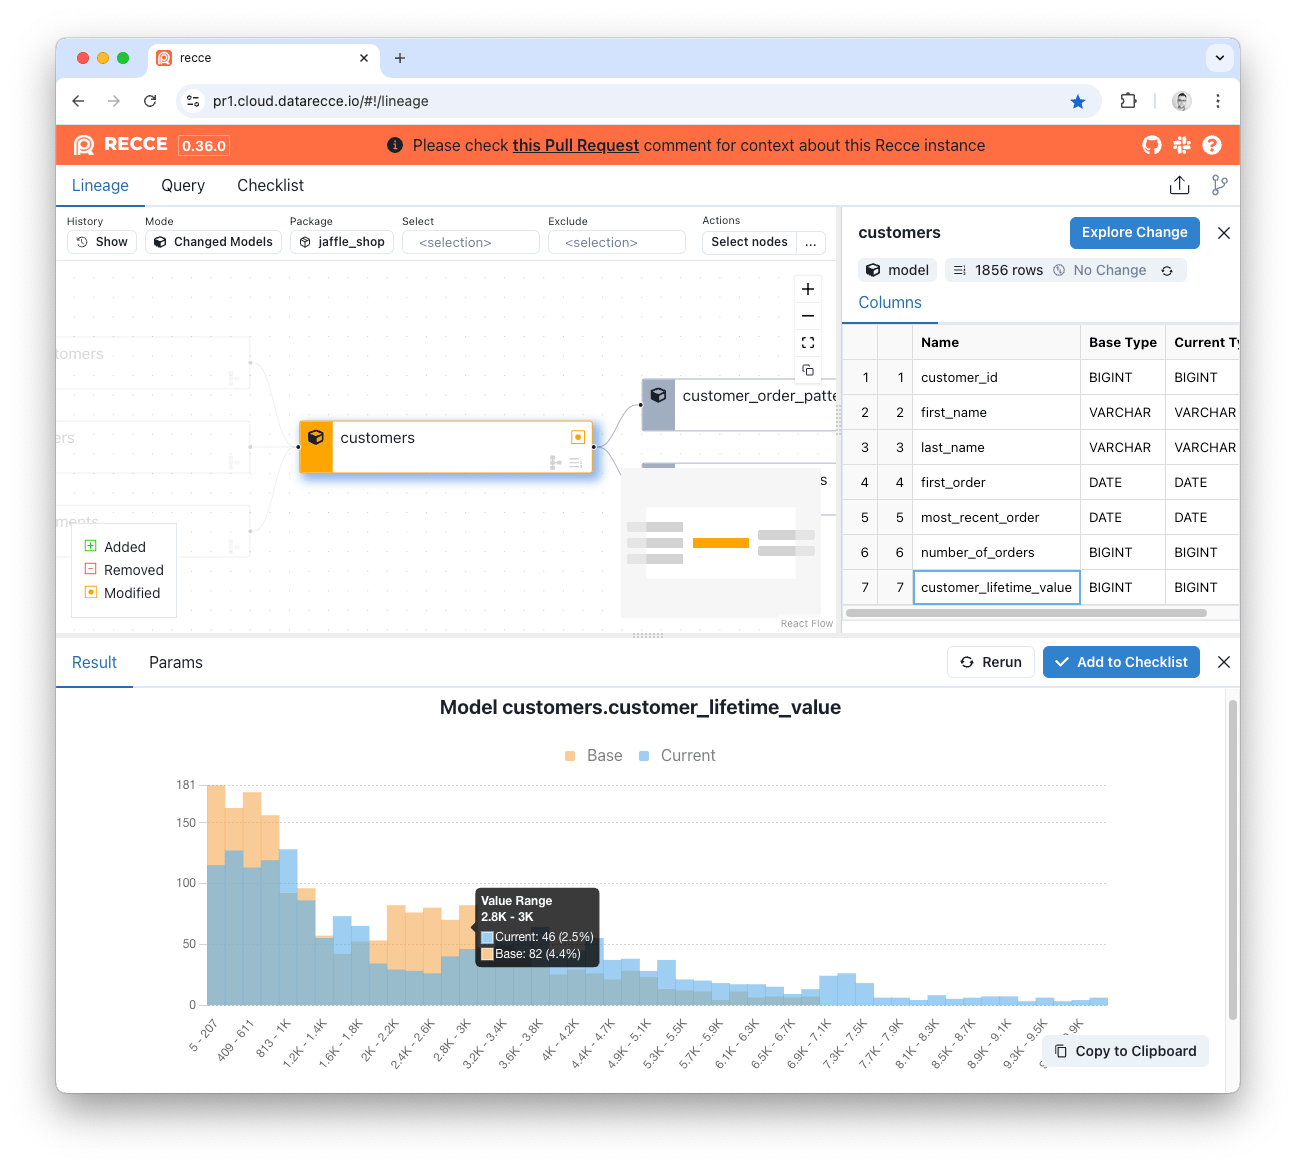
Histogram Diff
Compare the distribution of numeric columns using binned histograms.
When to use: Validate numeric distributions haven't shifted (amounts, scores, durations).
Running Histogram Diff
Via Explore Change:
- Select model > Explore Change > Histogram Diff
- Select a numeric column
- Click Execute
Via Column Menu:
- Hover over a numeric column
- Click ... > Histogram Diff
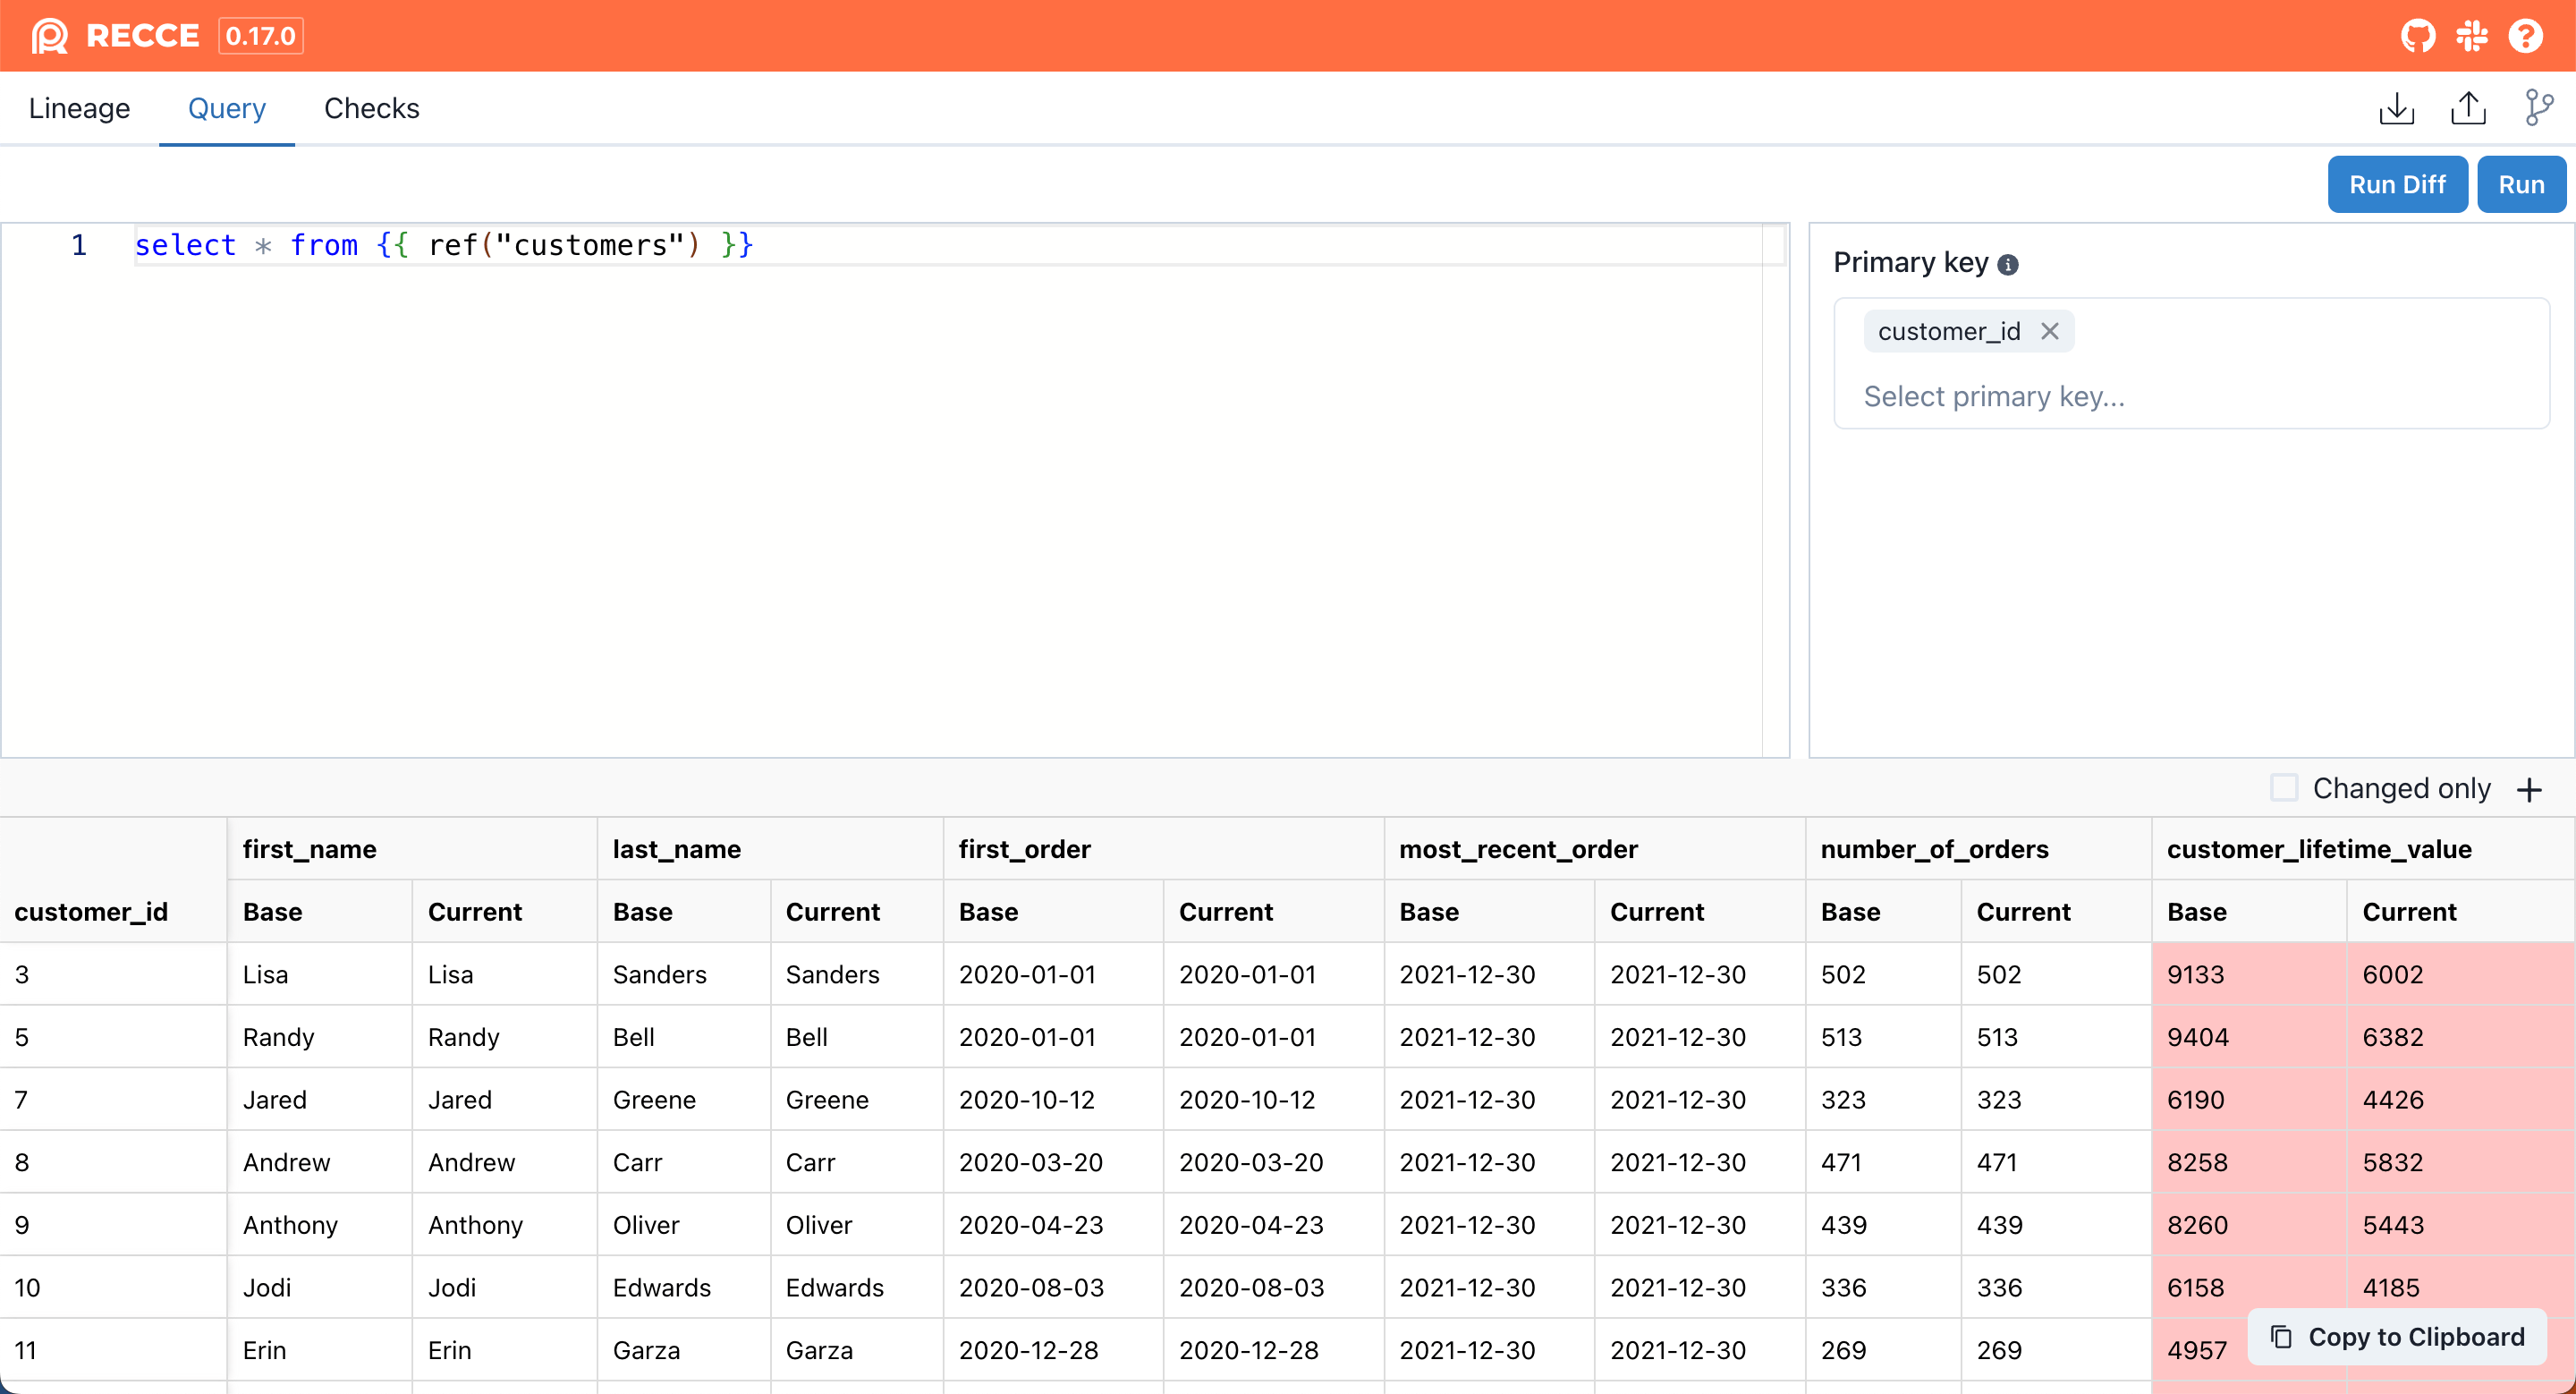
Query Diff
Write custom SQL to compare any query results between environments.
When to use: Flexible validation for complex scenarios not covered by standard diffs.
Running Query Diff
- Open the Query page
- Write SQL using dbt syntax:
- Click Run Diff
Comparison Modes
| Mode | When to Use | How It Works |
|---|---|---|
| Client-side | No primary key | Fetches first 2,000 rows, compares locally |
| Warehouse | Primary key specified | Compares in warehouse, shows only differences |
Keyboard Shortcuts (Mac)
⌘ Enter- Run query⌘ ⇧ Enter- Run query diff
Result Options
| Option | Description |
|---|---|
| Primary Key | Click key icon to set comparison key |
| Pinned Column | Show specific columns first |
| Changed Only | Hide unchanged rows and columns |
Related
- Lineage Diff - Visualize change impact
- Checklist - Save validation results